
Sklearn: Pipeline diagram
Estimators can be displayed with a HTML representation when shown in a jupyter notebook. This can be useful to diagnose or visualize a
Pipelinewith many estimators. This visualization is activated by setting the display option insklearn.set_config:
from sklearn import set_config

set_config(display='diagram')
# displays HTML representation in a jupyter context
model
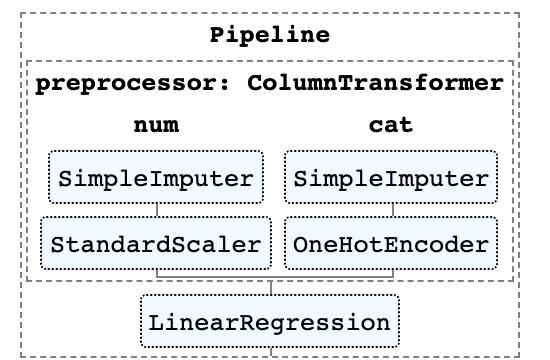
Via towards data science and scikit-learn.org.

Leave a comment