
Sklearn: Tree diagram
The
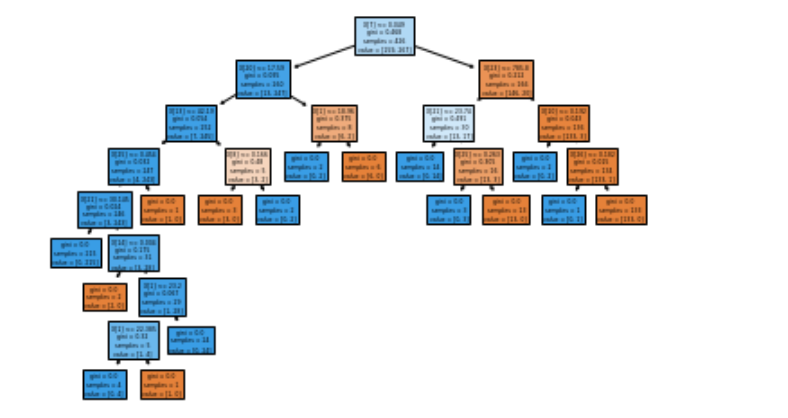
plot_tree()function allows you to create a diagram of steps present in a decision tree model:
import matplotlib.pyplot as plt
from sklearn import metrics, model_selection
from sklearn.tree import DecisionTreeClassifier, plot_tree
from sklearn.datasets import load_breast_cancer

X,y = load_breast_cancer(return_X_y = True)

X_train, X_test, y_train, y_test = model_selection.train_test_split(X, y, random_state=0)
clf = DecisionTreeClassifier()
clf.fit(X_train, y_train)

plot_tree(clf, filled=True)
plt.show()
Via towards data science.


Leave a comment